

A financial report matters when it helps shape a decision. For businesses seeking financial reporting and analysis in Rochester, the process brings together reports on past performance, analysis of what drove the results, and forecasts that help inform what comes next. A budget-versus-actual report, for example, compares results with plans and highlights variances to examine.
Financial reporting and analysis in Rochester can help business owners see more than what has already happened. When financial information is consistent, timely, and connected to decisions, it can clarify cash flow, show how the business is performing, and support planning.
This article explains how reporting, analysis, and forecasting work together, why consistent processes and relevant benchmarks matter, and how businesses can apply the results. It also covers practical tools for organizing financial information and making it useful.
Key Takeaways
- Use budget-versus-actual analysis to spot meaningful variances and understand what may be driving them.
- Document regular reporting steps so financial information stays current, complete, and consistent over time.
- Choose relevant benchmarks to put performance in context and identify where closer analysis may help.
- Apply reporting insights to decisions about cash flow, planning, and business priorities.
What is financial reporting, analysis, and forecasting?
Financial reporting presents a business’s results and financial position through statements and reports. Analysis explains what the figures mean, while forecasting uses current information to estimate future conditions. Together, these practices help owners assess financial health and track progress.
Budget-versus-actual analysis compares planned figures with actual results. Higher-than-planned revenue may reflect stronger sales, while higher-than-planned expenses may signal rising costs. Investigate the cause, decide whether it is temporary or recurring, and adjust the forecast or operating plan if appropriate. A variance is a reason to look closer, not an explanation on its own.
The right reporting standards depend on a business’s circumstances. In the United States, GAAP provides a common framework for consistent reporting; requirements may call for GAAP, IFRS, or both. Publicly traded U.S. companies file quarterly and annual results with the Securities and Exchange Commission, while tax reporting must follow Internal Revenue Service criteria. The applicable framework shapes how financial results are presented.
In Rochester, New York, the City of Rochester lists adopted operating and capital improvement budgets for 2024-2025 and 2026-2027. City budget preparation connects operating plans with capital priorities; adoption gives the public plan an approved form. Fund equity and budgetary compliance help show how resources relate to authorized uses. Rochester Public Utilities budgets belong to a public-utility context, distinct from a private company’s statements.
Different tools serve different purposes. A Workday project budget balance report can organize project budget information for comparison with actual activity. A spreadsheet can model scenarios or isolate a variance. Monthly statements provide a recurring view of results, while an annual report summarizes performance across the year.
When seeking financial reporting and analysis in Rochester, look for support that explains reporting methods, investigates variances, and connects forecasts to business decisions. Wright CPAs provides bookkeeping, customized financial reporting, and CFO Services for business owners in Rochester, Buffalo, and Syracuse. The right approach aligns reporting with the business’s needs and applicable standards.
Documented and consistent reporting processes
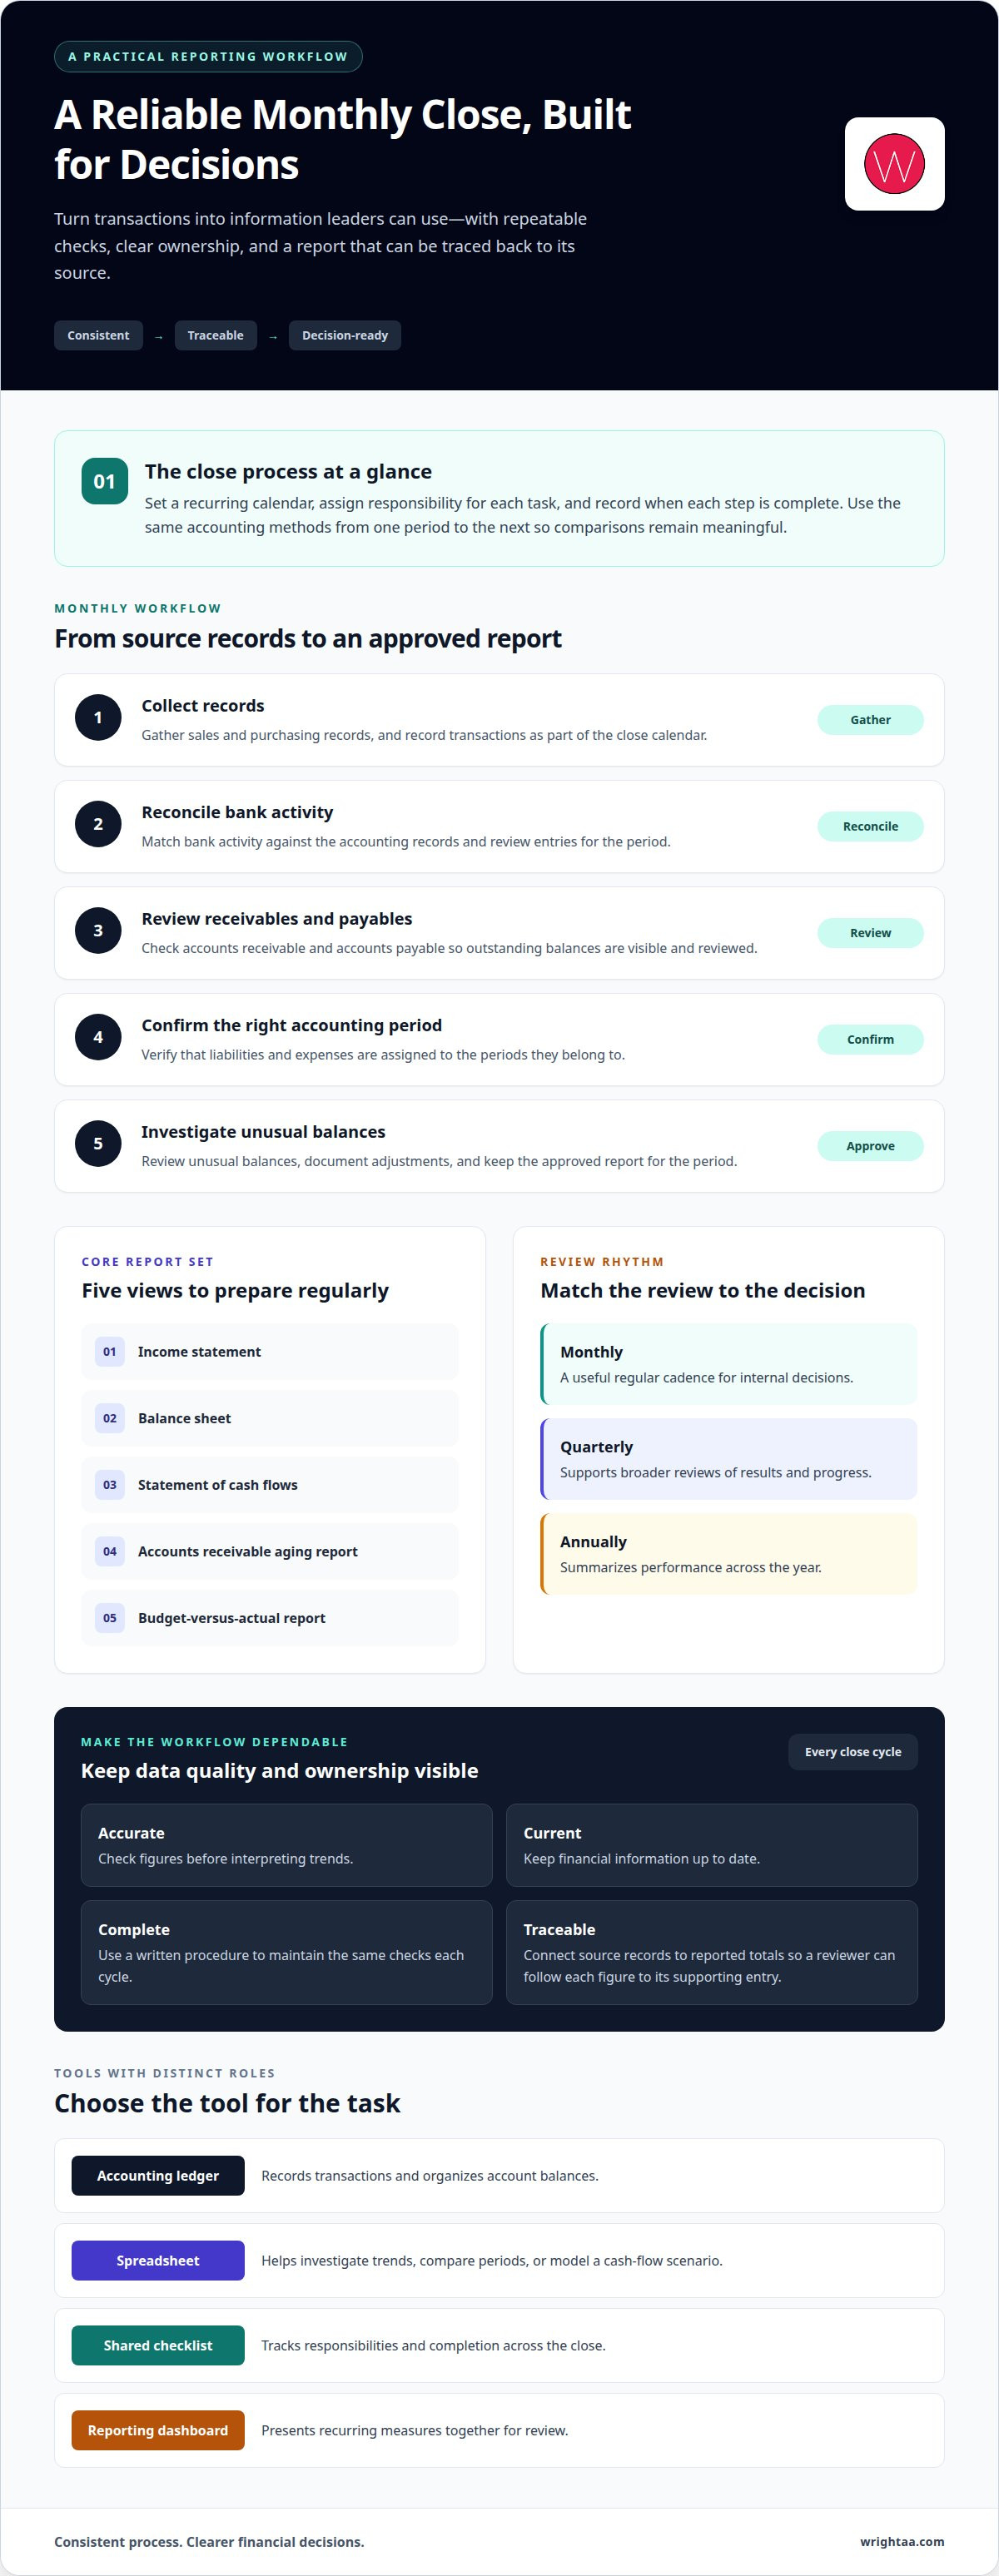
A documented close process turns scattered transactions into information leaders can use. Set a calendar for recording transactions, reconciling accounts, reviewing entries, and preparing reports. Assign responsibility for each step and record when it is complete. This makes missed entries and late approvals easier to trace. Consistent accounting methods from one period to the next also help keep trend comparisons meaningful.
What financial reports should a Rochester small business prepare, and how often? A useful core set includes an income statement, balance sheet, statement of cash flows, accounts receivable aging report, and budget-versus-actual report. Prepare and review them on a regular schedule, often monthly for internal decisions, with quarterly and annual reports supporting broader reviews.
Reliable reports depend on data that is accurate, current, complete, and consistent. A practical monthly workflow can begin with collecting sales and purchasing records, reconciling bank activity, and reviewing accounts payable and receivable. Then confirm that liabilities and expenses are assigned to the right periods. Finally, review unusual balances, document adjustments, and keep the approved report. A written procedure helps maintain the same checks each cycle, even when staff or responsibilities change.
Choose tools for specific tasks. An accounting ledger records transactions and organizes account balances. A spreadsheet helps investigate trends, compare periods, or model a cash-flow scenario. A shared close checklist tracks responsibilities and completion, while a reporting dashboard can present recurring measures together. Keep source records connected to reported totals so a reviewer can trace each figure to its supporting entry. That traceable process makes proactive review more useful than simply producing statements.
With these routines in place, reporting can support strategic choices rather than remain a month-end task. For help connecting financial information with business priorities, structured business planning can bring reporting routines into a clearer decision process.
Performance analysis and industry benchmarking
Performance analysis turns accounting results into a clearer view of the business. Start with a focused set of measures tied to decisions, such as revenue trends, operating costs, cash available, or collection patterns. Compare each measure across consistent periods and investigate notable changes. A one-page summary can show the result, its likely cause, and the action under consideration. Check that the underlying figures are accurate before interpreting trends; a polished chart cannot fix inconsistent inputs.
Benchmarking adds context only when the comparisons are relevant. Compare businesses with similar services, operating models, and reporting periods. For example, a law firm reviewing realization or collection patterns needs comparisons that reflect legal practices, not a retailer’s sales cycle. Accounting principles and classifications should align as well. Otherwise, differences may reflect reporting methods rather than performance. Explain unusual conditions, such as a new service line or a change in client mix, before drawing conclusions.
The City of Rochester lists performance measures for 2023, illustrating how an organization can track defined outcomes over time. That public-sector example is not a direct benchmark for a private business. It does show why each measure needs a clear definition, a consistent calculation, and a stated purpose. A business can apply the same discipline by documenting what each metric includes and who reviews it.
- Excel: Compare periods, calculate ratios, and build simple variance tables from organized accounting data.
- Power BI: Present connected measures in dashboards, helping teams monitor patterns across departments.
- QuickBooks reports: Review account-level activity and prepare a starting point for management summaries.
Use a repeatable review: select a measure, compare it with a suitable reference, explain the gap, and assign a next step. A benchmark is a guide, not a verdict. For example, rising receivables may prompt a review of billing timing, collection practices, or client terms. Record the explanation alongside the result, then monitor whether the chosen response changes later reports. This turns comparison into a practical management tool.
Uses of financial reporting and analysis
Financial statements are most useful when they inform a specific decision. A hiring plan, for example, should account for expected payroll alongside projected sales and available cash. Reviewing these figures together helps owners judge whether added capacity supports performance or could strain the business. The review should connect the decision to its assumptions, not just display totals.
Reporting also helps owners set priorities across different time horizons. A near-term cash forecast can inform when to schedule a large purchase, while an annual comparison can show whether the business’s direction matches its operating plan. A balance sheet adds context by showing assets, liabilities, and equity at a point in time. Together, these views help leaders turn financial information into deliberate action.
Use financial information to investigate a question, record the decision, and revisit the result. If service revenue rises but cash receipts lag, examine billing timing and outstanding invoices before expanding delivery capacity. If costs increase in one area, separate recurring expenses from one-time purchases. This helps prevent a temporary shift from being mistaken for a lasting change in performance.
- Rolling forecast spreadsheet: Model how changes in expected sales, costs, or payment timing affect upcoming cash needs.
- Management dashboard: Present selected measures together, so decision-makers can see changes without sorting through detailed ledgers.
- Decision log: Record the financial evidence, chosen action, and later outcome, preserving context for the next review.
These tools support decisions about timing, staffing, purchasing, and operating priorities, but they do not make decisions on their own. Leaders still need to consider customer demand, delivery capacity, and the assumptions behind each forecast. For example, weigh a projected sales increase against the people and materials needed to fulfill orders. A short written review can capture the expected benefit, financial exposure, and conditions that would prompt a change in course.
Use reporting to make the next business decision clearer. Connect financial insight with your business decisions.
Wright CPAs
Wright CPAs helps business owners use financial information with greater clarity through bookkeeping, CFO Services, cash flow management, and tax planning and preparation. These services can help when records need structure, cash-flow patterns need closer attention, or financial results need to guide upcoming decisions.
Bookkeeping keeps records organized, while CFO Services provide a broader perspective on reporting and planning. Tax planning and preparation connect financial records with tax needs. The right starting point depends on what is making decisions difficult, whether that is incomplete records, limited cash-flow visibility, or uncertainty about how results affect the next business move.
Contact Wright CPAs to discuss the financial information and decisions you would like to bring into sharper focus.
Put your financial information to work
Start by choosing one decision your current financial information should help clarify. It might involve a hiring plan, a cash-flow concern, or how tax planning fits the business’s direction. Defining the decision gives a reporting review a practical purpose and helps identify which records or perspectives would be useful.
For businesses seeking financial reporting and analysis in Rochester, Wright CPAs provides bookkeeping, payroll services, and Tax Planning and Preparation. These services help organize records and connect business activity with tax and payroll needs. The focus is on making financial information useful for decisions ahead, rather than adding reports without a clear purpose.
Bring forward the question you’re trying to answer and the information you currently use. Contact Wright CPAs to discuss your reporting and consider a thoughtful next step for your business.
Frequently Asked Questions
How can Rochester businesses use financial statement analysis to assess performance and cash flow?
Compare financial statements to see whether reported earnings are translating into available cash. For example, review sales trends alongside customer payment timing and upcoming supplier obligations. If earnings rise while cash tightens, slower collections, inventory purchases, or other timing factors may explain the gap. This helps owners frame a specific question before changing spending or operating plans.
What is the difference between financial reporting, bookkeeping, and financial analysis?
Bookkeeping records and organizes transactions; financial reporting arranges those records into useful summaries; financial analysis interprets the results. For example, bookkeeping captures customer invoices and payments. A report can show outstanding receivables, while analysis considers whether delayed payments affect available cash or the timing of planned purchases. Each has a distinct role, and analysis depends on reliable records.
What software do Rochester businesses use for financial reporting and analysis?
Businesses may use QuickBooks to organize accounting records, Excel to examine figures or model scenarios, and Power BI to display selected measures in dashboards. The right combination depends on the accounting workflow, reporting needs, and how leaders use the results. For instance, a small team may need clear account summaries, while a larger operation may benefit from combining several data sources.
What are common financial reporting errors and compliance risks for Rochester businesses?
Common problems include duplicate or missing transactions, inconsistent account categories, and income or expenses recorded in the wrong period. These errors can distort statements and weaken comparisons. Keep supporting records aligned with reported figures and use consistent accounting methods. Reporting may involve GAAP, while tax reporting must follow Internal Revenue Service criteria, so careful classification and recordkeeping matter.


